An early look at North Carolina's 2026 electoral shifts
Published 3:01 p.m. today
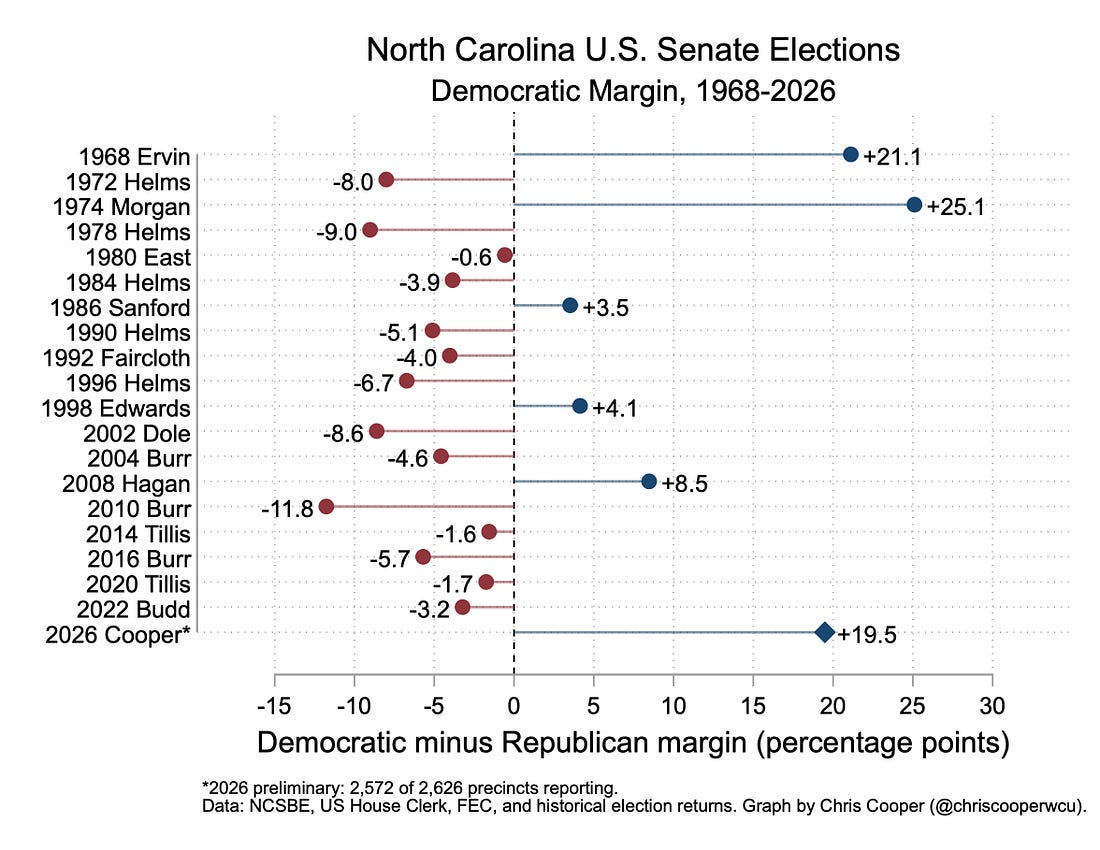
The 2026 mid-term election brought an incredible amount of electoral shifts across the nation, and most notably in North Carolina. The nearly 20-point win by Democrat Roy Cooper over Republican Michael Whatley is, in modern N.C. politics, unheard of, and you have to go back to 1968 and 1974 to find a higher margin of victory in the state, as documented by my colleague Dr. Christopher Cooper of Western Carolina University:
 |
For the U.S. House contests, the shift from a 10-4 Republican-advantage congressional delegation to what looks like (as of this post¹) an 11-3 Democratic-advantage is pretty mind-boggling.
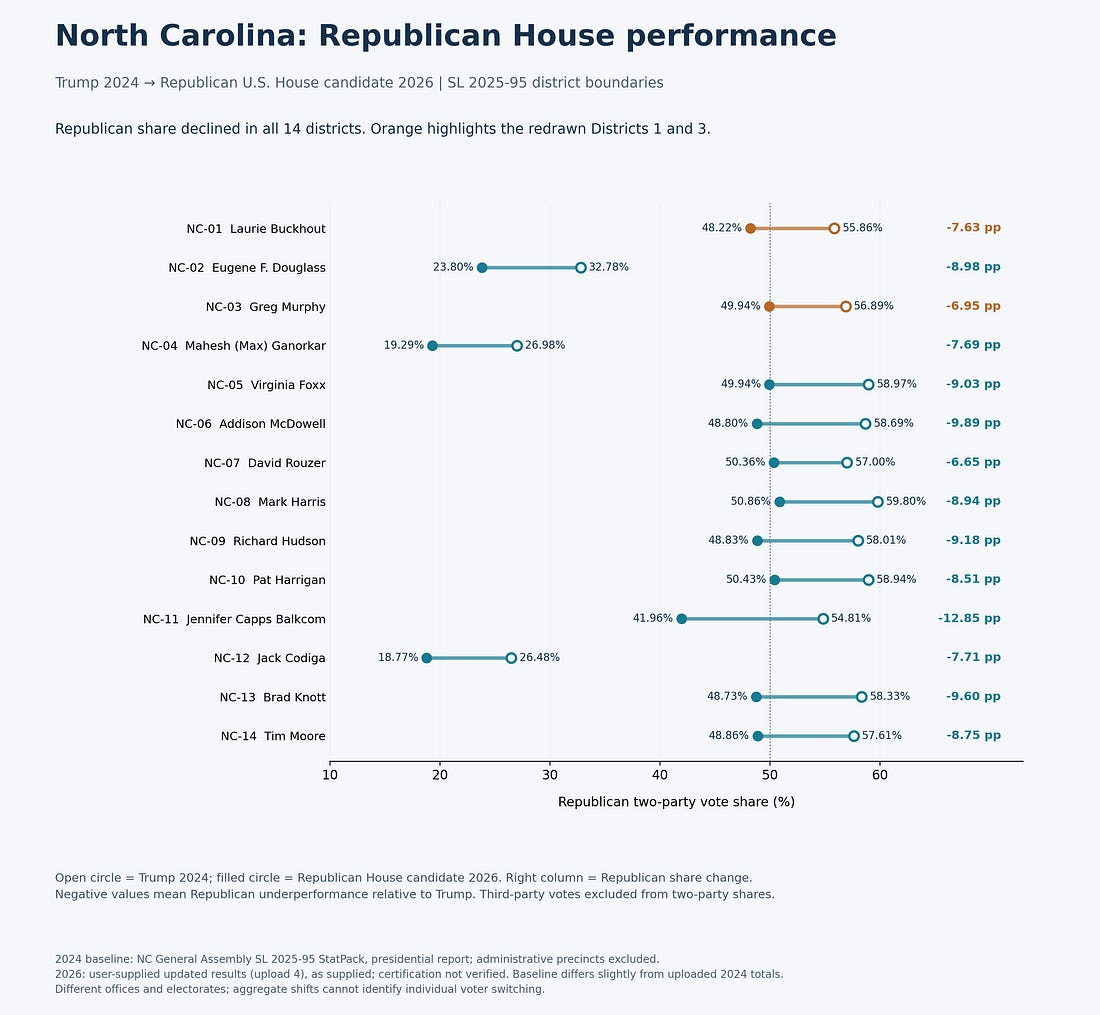 |
And while all the U.S. House districts experience some significant shifts, it also demonstrates that the shifts were across the state, and not just limited to a few congressional/geographic areas.
In North Carolina, geographic/regional partisanship is a dominate factor in helping to understand the overall competitive nature of the state’s purple status. In my thinking about the state’s regionalism, I look at four distinctive regions, based on the Office of Management & Budget’s county classifications: the central cities of North Carolina (think Charlotte, Raleigh, Winston-Salem, Greensboro, Wilmington, Asheville, etc.) and the urban suburbs in those counties (outside of the central city limits but still within the urban county); the surrounding counties that are often within/tied to that urban county; and the remainder being rural counties.
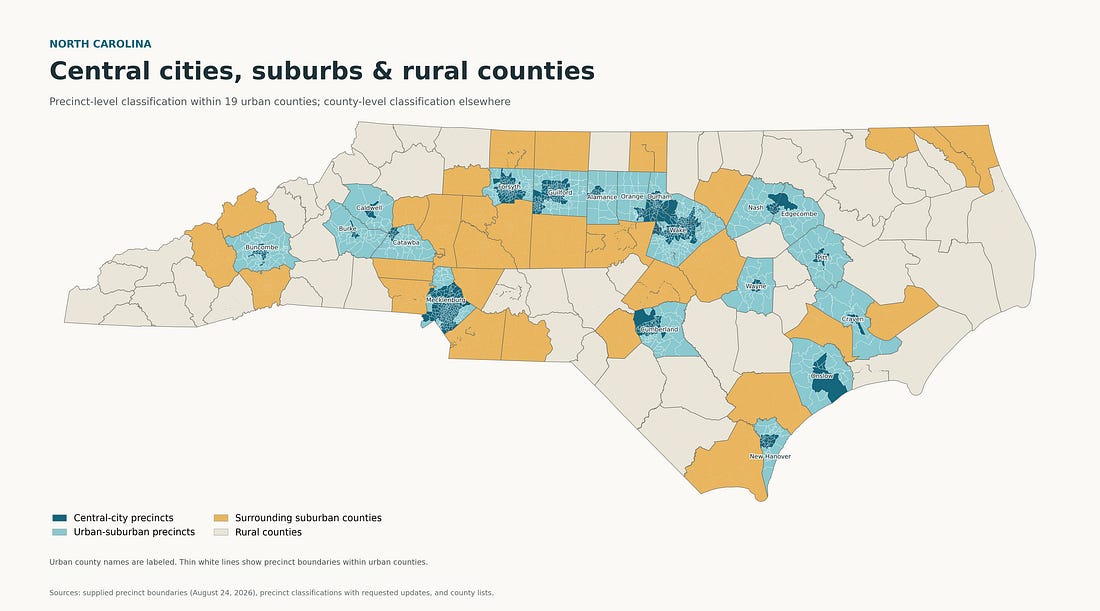 |
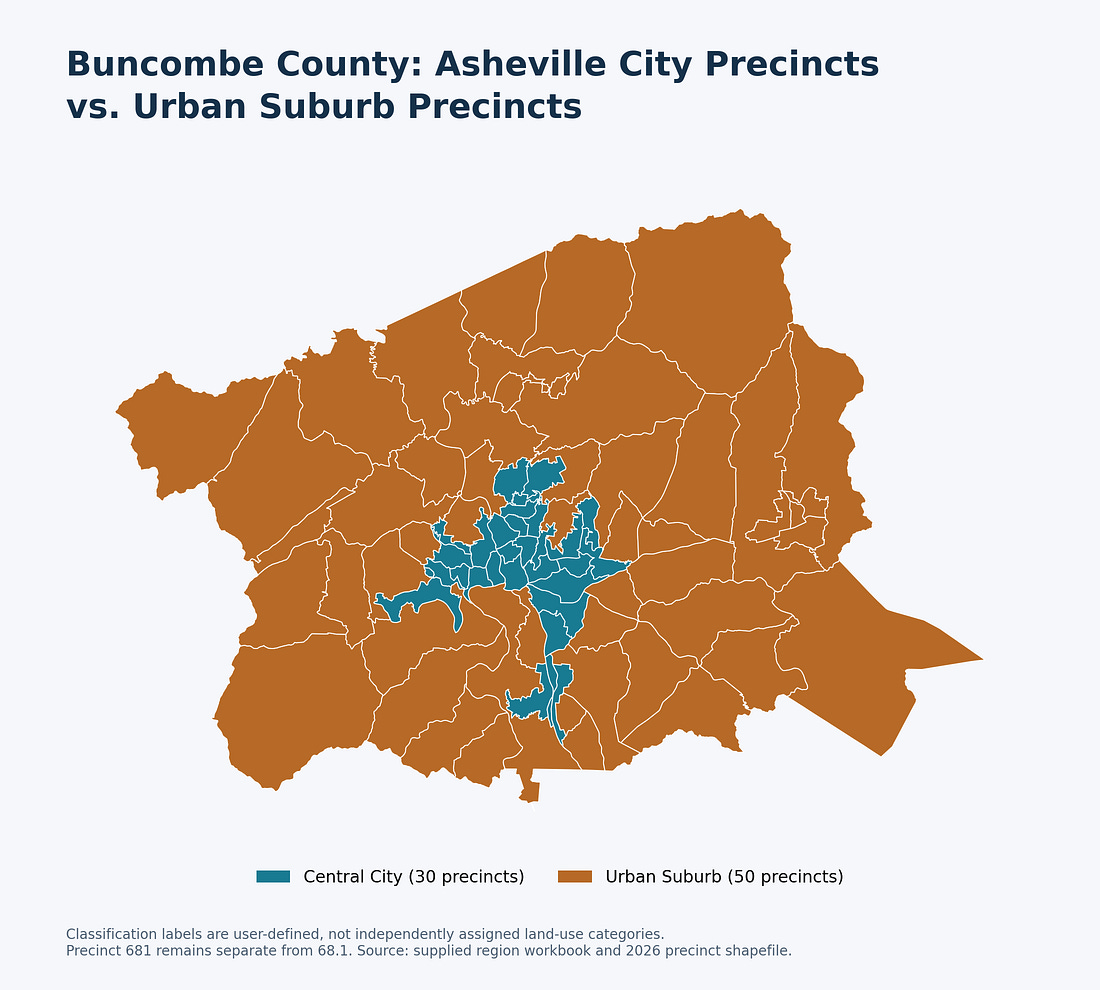
For the urban counties, I split the precincts into two groups: those that are within the central city limits, and those precincts outside the city limits. The surrounding suburban counties and rural counties are analyzed based on their county-level returns so far.²
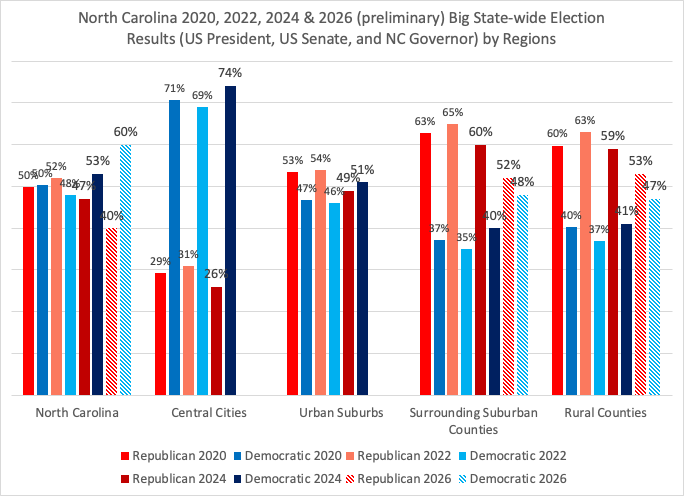
Having those four regions, I took the past four general elections and totaled up the following big state-wide results for the state and in each region:
-
2020: U.S. President, U.S. Senate, N.C. Governor
-
2022: U.S. Senate
-
2024: U.S. President, N.C. Governor
-
2026: U.S. Senate
While we see a generally competitive state in 2020, 2022, and 2024, the 2026 Democratic blow-out for the two-party vote is a clear outlier
 |
For the urban counties and their central city vs. urban suburb precincts, I have to await the counties to release their precinct-level sorted election results that assigns the votes from early ballots back to the voter’s respective precincts.
But for the surrounding and rural counties that aren’t necessarily dependent upon precinct-level results, we can get an early glimpse of the 2026 dynamic—and it was stark.
The general electoral rule of thumb for the surrounding suburban counties is that they are the most Republican region of the state: usually in the neighborhood of a 65-35 Republican split. But this year, that split shrank to 52-48 Republican—within the traditional ‘competitive’ bandwidth.
And in looking at the 30 NC surrounding suburban counties, they saw a nearly 12 percentage point Democratic shift from the 2024 presidential performance to the 2026 U.S. Senate results.
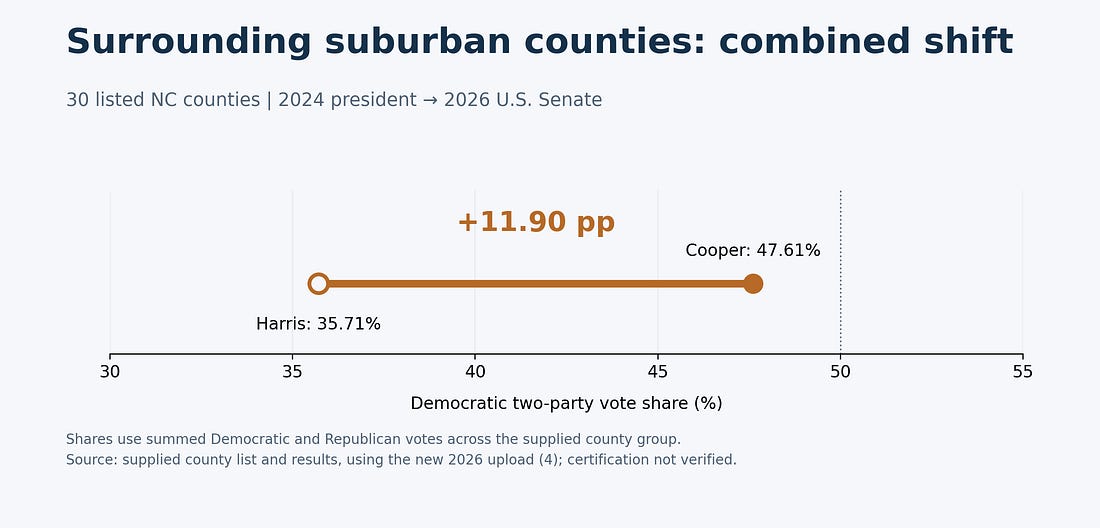 |
For state-wide Republicans, their electoral base is in these suburban counties, and to have such a significant shift from 35% Harris to 48% Cooper is remarkable.
The other major component to the N.C. Republican electoral base is within the rural counties of the state. And like the suburban counties, they too saw a dominant shift overall.
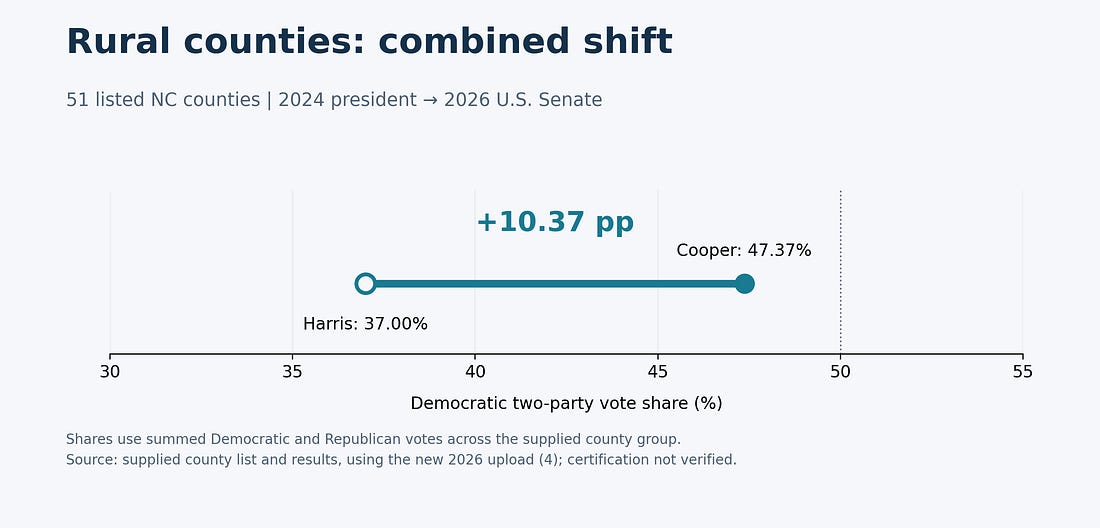 |
With a ten-percentage point shift in those counties, Whatley never really stood a chance.
Two more data-layers that we will need for further analyses will give us a more complete picture: one, the remaining counties that will need to provide their sorted precinct-level returns from the early votes, and two, the voter history data file, that tells us (especially by party registration) who actually showed up to cast ballots on election day.
But in the meantime, we do have two urban counties that have provided their sorted precinct-level returns: Buncombe, home to Asheville, and Forsyth, home to Winston-Salem. Here’s how each county’s precinct map breaks down into the respective central-city versus urban suburbs:
 |
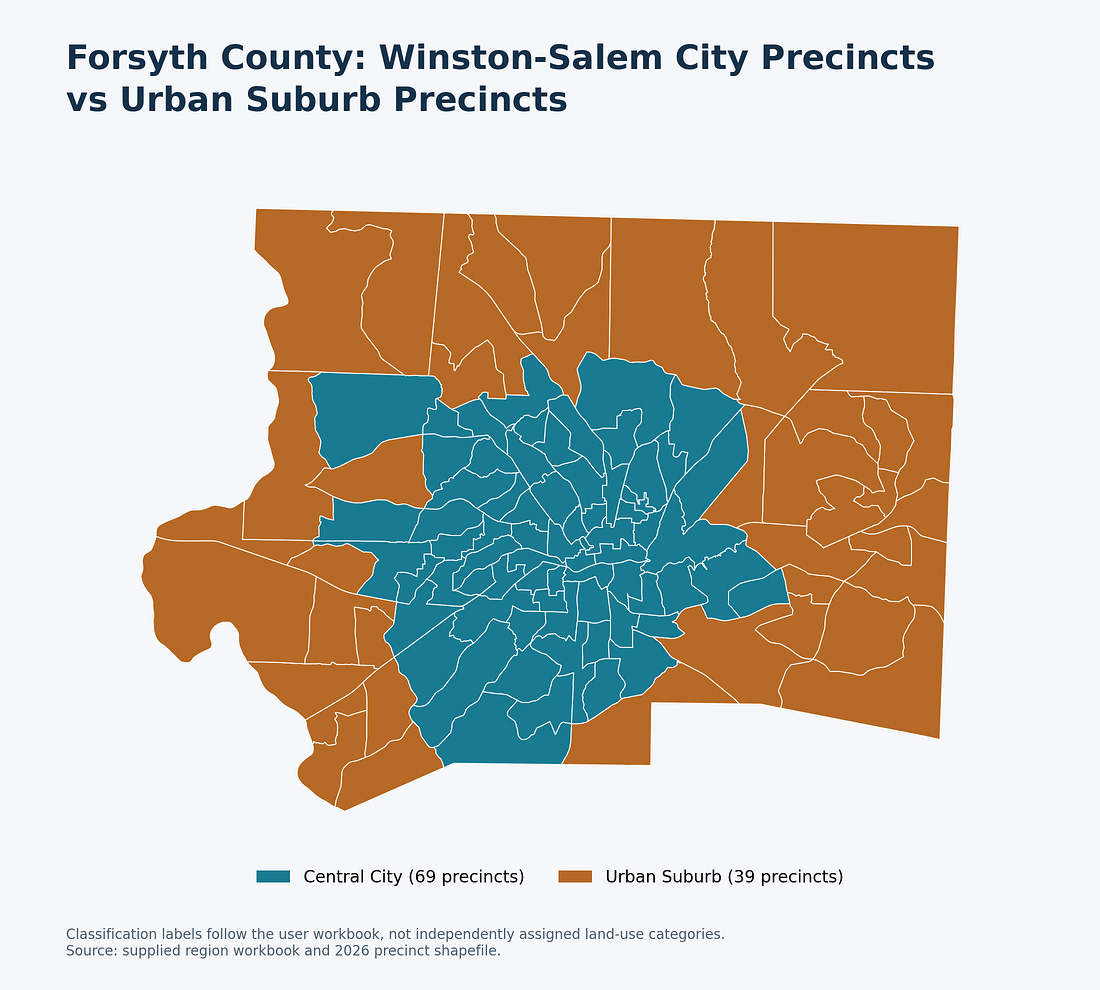 |
By combining the two counties and splitting their precincts into the two categories, we can at least get a preliminary sense of what we might expect from the other urban counties in North Carolina and their respective vote-share shifts this year:
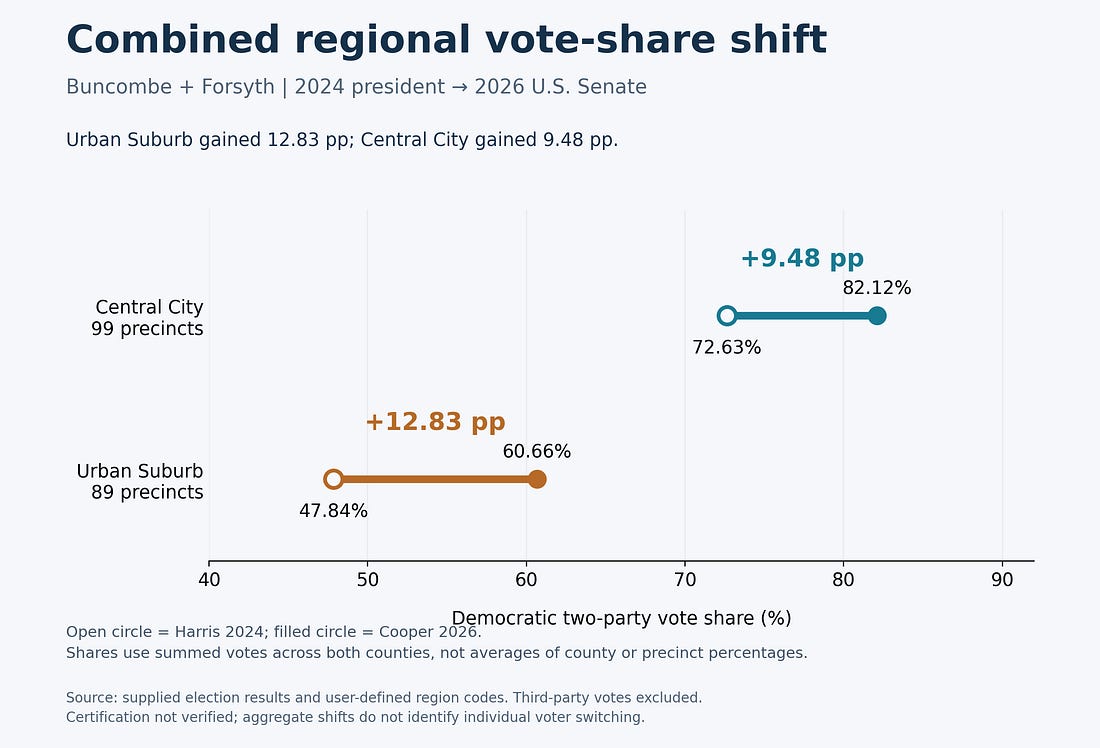 |
The most notably dynamic is the urban suburb’s shift of nearly 13 percentage points, compared to a 9.5 shift in the central city precincts. Granted, it’s not surprising that Asheville and Winston-Salem have a combined 82 percent support for Cooper, but to see the competitive urban suburbs go from 48% Harris to 61% Cooper helps to better understand the real tsunami/rip-current that impacted North Carolina’s 2026 election.
We will of course need the remaining urban counties—Wake, Mecklenburg, Durham, and others—to get the fuller picture of this urban dynamic, but a preliminary sense of things shows that the competitive region of the state—that of the urban suburbs—may be the leading driver of the remarkable set of election returns we witnessed on November 3.
The early returns from this geographic analysis suggest that North Carolina’s 2026 election was about much more than a Democratic surge in the state’s largest urban centers. In fact, some of the most consequential shifts occurred in the very places that have traditionally provided the foundation for Republican statewide success: the surrounding suburban counties and, to a lesser extent, the state’s rural counties.
But perhaps the most intriguing finding so far is the movement within the urban suburbs. These are the communities that have often defined North Carolina’s competitive political character, and seeing them shift nearly 13 percentage points toward Roy Cooper provides an important clue to understanding the magnitude of this year’s results.
There is still more to unpack. The remaining precinct-level returns, particularly from the state’s largest urban counties, and the voter history data will help us distinguish between changes in voter participation and changes in voter preference. I also want to examine how population density within the surrounding suburban and rural counties may help explain these electoral shifts.
And one other warning against over-interpretation of these dramatic 2026 electoral dynamics in North Carolina. As a mentor of mine recently observed about the wave that descended on Georgia:
Jubilant Democrats will be tempted to declare 2026 a realignment. Not to diminish Democratic wins, but one election does not a trend constitute. For there to have been (an electoral) realignment, Georgia will have to vote for the Democratic presidential nominee in 2028, and Democrats will need to retain most of the gains made this year into the 2030s. Winners always attribute success to their charisma, campaigns, and issues. In reality, some candidates get elected because voters rejected their opponents. Winners who over-interpret the results or their own magnetism are likely to have short tenures.
The exact same thing can be said about North Carolina. Taking this year’s intense results will not necessarily equate to 2028, let alone 2030. But we’ll deal with that soon enough.
For now, one thing is becoming increasingly clear: the 2026 election was not simply a story of Democratic strength in North Carolina’s cities. It was a story of significant movement across the state’s electoral geography, especially in the communities that have traditionally made North Carolina one of the nation’s most competitive political battlegrounds.
And exploring and understanding those shifts may be just as important as understanding the election results themselves.