Labor market returns to degrees
Published April 18, 2019
We reported recently that the level of educational attainment among North Carolina’s degree-earners continues to rise. This is related, in part, to a shifting job market favoring higher-skilled workers. However, as more individuals seek out greater levels of postsecondary education, the question remains as to whether these advanced degrees continue to provide larger financial returns over the course of an individual’s life.
A publication from Georgetown University’s Center on Education and the Workforce sought to answer this question, and determined that there are four general rules to earnings and education:
Rule 1: Degree level matters.
In general, higher degrees are associated with higher earnings.
Rule 2: Occupational choice can trump degree level.
Individuals with less education may earn more in higher-paying fields, such as STEM careers, than those with more education in lower-paying fields.
Rule 3: Although occupation can trump education, degree level still matters most within individual occupations.
Individuals with more advanced education in their career field earn more than those that with lower levels of education.
Rule 4: Race/ethnicity and gender are wild cards.
These demographic factors can play a larger role in future earnings than even education or occupation.
Georgetown’s analysis used national-level data, so we decided to investigate how well these rules hold up for workers in North Carolina. In this blog post, we examine the first rule—whether degree level matters—on degree level attainment and earnings advantages over time. We will look at the other rules in future posts.
Our findings at the state level closely matched Georgetown’s national findings.
Calculating Synthetic Work-Life Earnings
For this analysis, we conducted a synthetic work-life earnings estimate. A “synthetic” estimate means that these are not the actual dollar amounts earned by real people over the course of their working lives (which would require an extensive amount of sensitive, longitudinal data). Instead, these are estimates derived from a point-in-time cross-sectional survey—the American Community Survey, in this case.
We focused on individuals aged to 25 to 64 because these are our prime working ages. We also chose to focus the analysis on full-time, year-round workers—defined as being employed at least 35 hours per week and working at least 50 weeks per year—because we believe that they are a better representation of wage returns to education in the labor market. This means that we are excluding workers who work seasonally, who work part time, or who drop out or stop out temporarily from the labor force.
Using wage and employment data, we calculated the median earnings for each 5-year age group between ages 25 and 64 for full-time, year-round workers in North Carolina by educational attainment. (So, for example, we looked at the median earnings for 25-29 year-olds with a high school diploma, an associate degree, a bachelor’s degree, etc.) We then calculated each educational group’s predicted lifetime earnings by multiplying each age category by 5 to obtain their estimated total salary for each age range. Finally, we summed the estimated total salary for each age range from 25-29 to 60-64 to obtain the total synthetic work-life earnings estimate.
For example: Let’s calculate the median earnings for a full-time, year-round employee with a bachelor’s degree
Median earning between 25-29: $42,000
Total salary for age range 25-29 = $42,000/year * 5 years = $210,000
Median earning between 30-34: $48,000
Total salary for age range 30-34 = $48,000/year * 5 years = $240,000
Median earning between 35-39: $56,000
Total salary for age range 35-39 = $56,000/year * 5 years = $280,000
Median earning between 40-44: $62,000
Total salary for age range 40-44 = $62,000/year * 5 years = $310,000
Median earning between 45-49: $66,000
Total salary for age range 45-49 = $66,000/year * 5 years = $330,000
Median earning between 50-54: $65,000
Total salary for age range 50-54 = $65,000/year * 5 years = $325,000
Median earning between 55-59: $65,000
Total salary for age range 55-59 = $65,000/year * 5 years = $325,000
Median earning between 60-64: $63,000
Total salary for age range 60-64 = $63,000/year * 5 years = $315,000
Lifetime earnings = sum of total salaries for each age range
$210,000 + $240,000 + $280,000 + $310,000 + $330,000 + $325,000 + $325,000 + $315,000
= $2,335,000 in lifetime earnings
Of course, these estimates come with necessary caveats and limitations. Education alone does not account entirely for a worker’s lifetime earnings, and, in some cases, sex and race/ethnicity play an even larger role in influencing earnings than one’s degree. In a future blog post, we will address the effects of sex and race/ethnicity on earnings potential over the course of a lifetime.
More broadly speaking, these estimates examine the median lifetime earnings of a worker with a given level of education. In other words, this means that half of individuals in each age range earn less than this amount, while half earn more. This is not meant to represent the lived experience of any specific worker.
What we learned: There are gaps in lifetime earnings based on the highest level of education that someone has completed
Any level of postsecondary attainment translates to greater lifetime earnings compared to an individual with a high school degree alone, and additional education beyond an associate or bachelor’s degree is correlated with higher earnings. Lifetime earnings for all workers in North Carolina range from just over $1 million for individuals with less than a high school diploma to nearly $4 million for professional degree-holders, such as lawyers and doctors.
This gap in lifetime earnings has widened over the last decade. For full-time, year-round workers, bachelor’s degree-holders in 2007 could expect to earn 78% more than workers with just a high school diploma/GED and 33% more than workers with an associate degree. As of 2017, those numbers had grown by one percentage point and four percentage points, respectively: workers in North Carolina with a bachelor’s degree in 2017 could expect to earn 79% more than workers with just a high school diploma or GED certificate and 37% more than associate degree-holders.
For every education group, anticipated lifetime earnings in 2017 were lower than in 2007.
We also found that over the last decade, median lifetime earnings for full-time, year-round workers have decreased for every level of educational attainment.
Workers with an associate had the largest drop in lifetime earnings. Those with an associate degree in 2017 make 7% less than those holding the same degree in 2007.
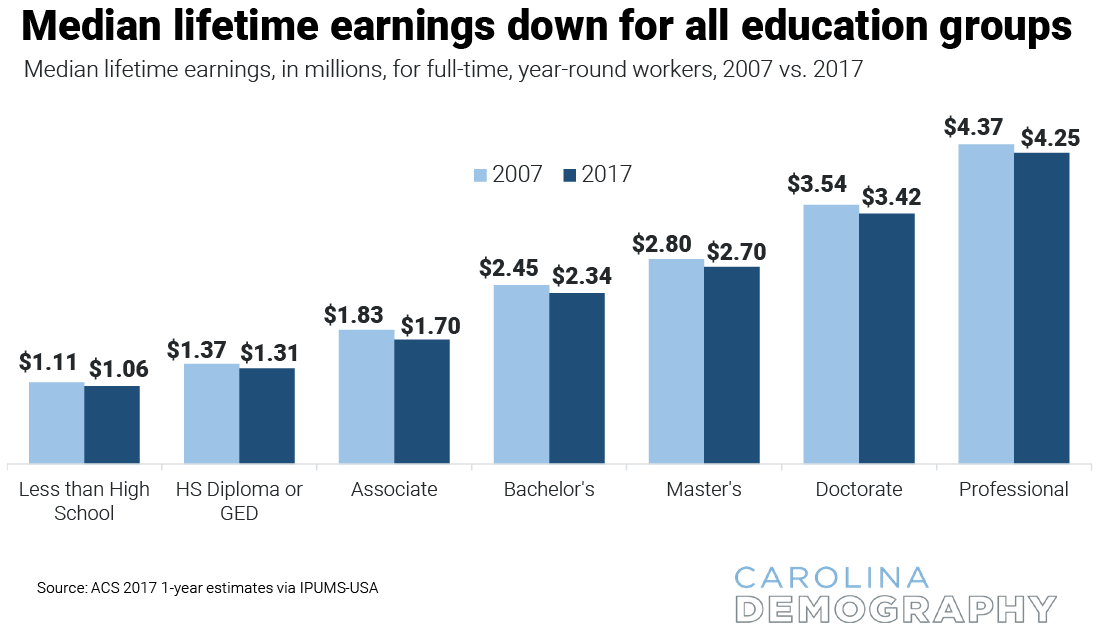
But full-time, year-round employees in North Carolina made less at every degree level. Compared to 2007, expected lifetime earnings in 2017 were:
- 5% less for those with less than a high school diploma;
- 7% less for those with a high school diploma or GED certificate;
- 5% less for bachelor’s degree-holders ;
- 8% less for master’s degree-holders;
- 3% less for doctoral degree-holders; and
- 7% for professional degree-holders.
Reasons for this are likely complex, but without fully accounting for the composition of the workforce, it is hard to definitively know what this means. It may be related to wages being slow to recover since the Great Recession. Age hiring trends may also play a role, as much of the hiring at the national-level has skewed towards younger age groups (16-24 and 25-34). These newer workers tend to earn less than older age groups. While this does not speak to North Carolina specifically, it is likely that the state is following similar trends as the nation.
The American Community Survey from the Census Bureau is a nationwide representative survey that collects data on a wide variety of social and economic factors, such as ancestry, educational attainment, housing characteristics, and employment.