Revisiting Whether It's Politics or Economics That Impacts a County's Vaccination Percentage?
Published September 30, 2021
Back in the middle of summer, I posted a simple analysis that looked at the 100 North Carolina counties and their full (second shot) vaccination percentages compared to whether a county voted for Trump, or whether other factors might influence the county vaccination percentage.
In that previous analysis, Trump's county vote percentage was statistically significant, meaning we can say with some confidence that it does have an impact and helps explain a county's vaccination percentage. But it appeared to be in conjunction with a county's per capita income, along with a few other 'variables' that ultimately helped to explain 62 percent of a county's full vaccination percentage.
Recently, the New York Times reported an analysis that showed that in counties that voted overwhelmingly for Trump (70 percent or greater) "the virus has killed about 47 out of every 100,000 people since the end of June," compared to 10 out of 100,000 in those counties that voted the reverse (less than 32 percent for Trump).
I decided to update the data for the number of full vaccinations in each N.C. county, and then created the percentage of those age 15 years and older for a county's full vaccination percentage to replicate the July analysis.
First, a scatterplot of the county full vaccination percentage against Trump's county vote:
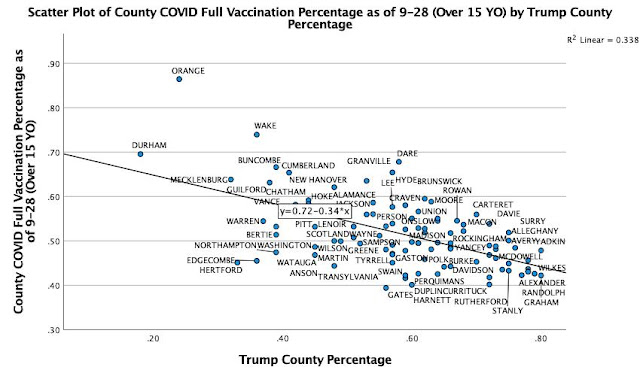
Back in July, the scatterplot showed a r-squared linear value of 0.164; now, that number is 0.338, showing improvement in explaining a county's vaccination percentage using Trump's 2020 vote percentage.
I decided to run a linear regression to see the adjusted r-squared rate, which came out to 0.332; meaning that one-third of a N.C. county's vaccination percentage could be explained by just the county's vote percent for Trump. Previously, that same adjusted r-squared number was 0.155.
Next, I ran a scatterplot analysis of the county's per capita income against the vaccination percentage. Back in July, the r-squared for that scatterplot was 0.427. Now, the value had dropped to 0.394.
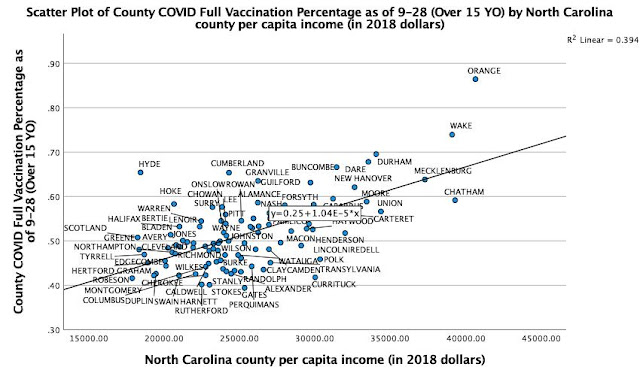
Again, running a linear regression with just the per capita income, the adjusted r-squared value came to 0.387, compared to July's 0.422.
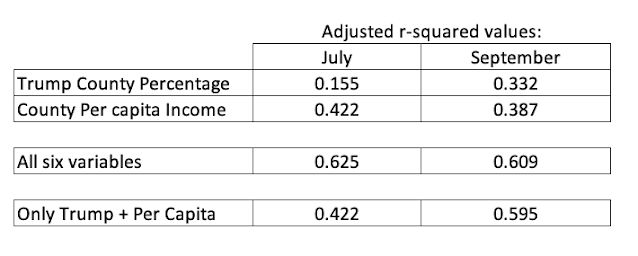
In July, when combining both Trump's county percentage, the county's per capita income, and other factors such as a county's non-White population percentage, its COVID case percentage, and dummy variables for either urban or rural counties, the overall explanation of a county's vaccination percentage was 0.625.
In re-running the same model, a number of dynamics have changed. The county's non-White percentage, COVID case percentage, and the dummy variable for rural counties all became statistically non-significant. The urban variable was barely significant (at the 0.5 level). But the two main variables--Trump's county percentage and per capita income--remained statistically significant.
In July, the explanatory power (adjusted r-squared) of those six variables was 0.625; now, the adjusted r-squared was 0.609, a slight drop.
However, when I dropped all of the variables except for the two main ones (Trump and per capita income), the adjusted r-squared was 0.595. Only a further slight drop in explanatory power, but with only two variables now, a remarkable difference.
To sum up what we are seeing in terms of explanatory power (the adjusted r-squared values) for the July and now the end of September analyses for all 100 NC counties and their vaccination percentages:
Using the analysis reported in the New York Times (those counties with over 70 percent Trump support and below 32 percent), I looked again at the scatterplots of those counties.
Now, a statistical word of caution: for this analysis, the number of N.C. counties goes from 100 down to 26, something that most statistical analysis would say "you really should be careful in assuming such a small 'n' (number of units of observation) with this analysis."
With that caveat, here's the scatterplot of per capita income against the 26 counties:
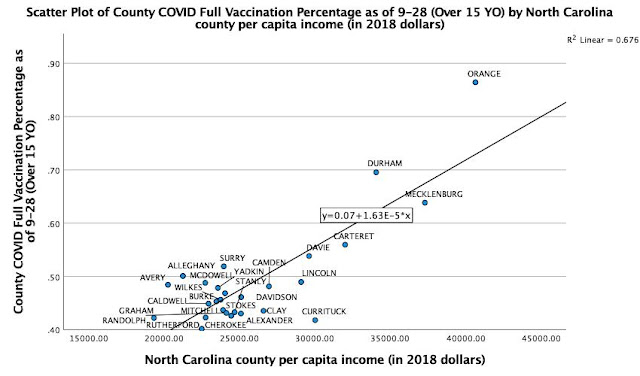
The r-squared value shot up to 0.676, meaning that potentially two-thirds of the full vaccination percentage in those 26 counties could be explained by the per capita income.
But when it came to the Trump county vote scatterplot for the 26 counties:
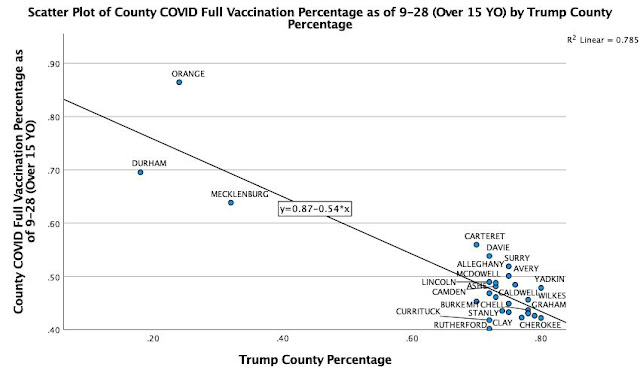
The r-squared value went up to 0.785, meaning that nearly 80 percent of the full vaccination rate in the 26 counties could be explained by the county's Trump percentage in 2020's election.
In fact, when running the linear regression with just the two variables, the per capita income rate drops out of statistical significance (at 0.089), while just using the Trump variable again had an adjusted r-squared rate of 0.776.
Thus, in those 26 counties, the single variable of Trump's 2020 vote percentage explains three-quarters of a county's full vaccination rate.
Of course, there are likely other explanations for the dynamics going on at this point in the pandemic. We'll need to continue to watch the dynamics of COVID vaccinations in the counties, but almost three months after the initial analysis, it appears that overall, North Carolina's county Trump vote percentage is becoming a better 'explainer' of a county's vaccination percentage.
--------------------
Dr. Michael Bitzer holds the Leonard Chair of Political Science and is a professor of politics and history at Catawba College. He is the author of the recently-published Redistricting and Gerrymandering in North Carolina: Battlelines in the Tar Heel State.