Lay of the political landscape: New voters - what do we know about who they are?
Published October 22, 2020
Given North Carolina's well-established position as a battleground state, it is not surprising that national political commentators are finding reasons to delve into voter registration and voter history trends in the Old North State. Armed with voter registration data that are available to anyone with a keyboard and a decent wi-fi connection, commentators and analysts are able to make conclusions about the size, shape, and scope of various constituencies within North Carolina's electorate.
Given the relevance of these data to answer all sorts of critical question, the disparate results that some of these various analyses reveal, and our own penchant for working with these data for many years, we thought we'd take the opportunity to share snapshot at new registered voters in North Carolina--a question that should be relevant to anyone who wants to understand whether and how the Old North State is changing.
Before getting to the guts of the analysis, it's worth noting that there are a number of ways to answer these questions--all of which use publicly available data. For example, one could simply navigate to the "Voter Registration Statistics" webpage on the NCSBE website, pull the numbers from two time points and do some simple subtraction.
Beyond that public interface, however, lies a more complete, albeit more complex dataset--the voter registration data file that lists individual records for all 7.2 million registered voters in the state. Digging into these data allows us to take a number of different snapshots of "new voters" in North Carolina, but it also presents a series of potential challenges in identifying who is "new" to the voter pool.
For example, one could simply use the "registration date" field. Seems simple and defensible, right? The problem is that a person's registration date updates not just when they first register to vote, but when they first register to vote in a county. For example, if you voted for 30 years in New Hanover County, then moved to Henderson County, you would receive a new registration data. Simply using the "registration date" code would therefore given a misleading perspective on who is a "new" North Carolina voter.
Given the problems of this code, we ultimately settled on using a piece of information within the dataset known as "NCID" that serves as a permanent voter identification number, even if the person moves from county to county. As long as you stay in North Carolina, you carry the same NCID number.
With the NCID as the key variable, we connected the October 10, 2020 voter registration data with the November 12, 2016 voter registration data. This allows us to determine which currently registered voters were registered four years ago, thus eliminating people who changed their voter registration since then 2016, but are not truly "new voters."
Using this coding system, nearly 1.4 million new voters have registered in North Carolina since 2017; the following chart gives the yearly numbers by party registration:

Since 2017, newly registered voters have avoided party identification when it comes to registration status: over 600,000 of 1.4 million selected Unaffiliated status (43 percent), while nearly 415,000 selected the Democratic Party (30 percent) and 365,000 went with the Republican Party (26 percent).
In looking at party percentages, the consistency of registration has been most notable:
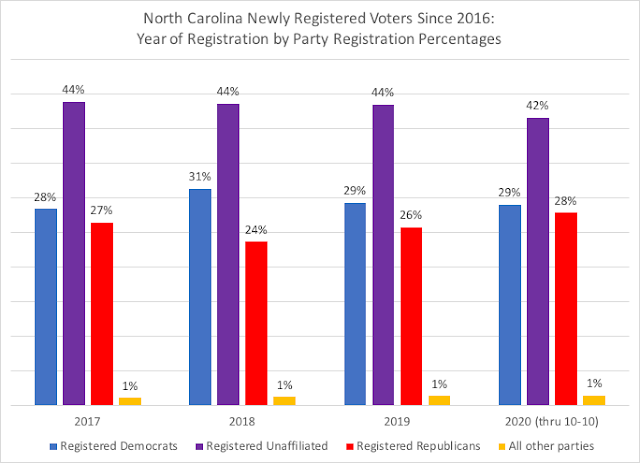
In the 'odd year' registrations of 2017 and 2019, the pattern tends to hold consistent, with only a one point difference in registered Democrats and Republicans between the two years. In the Democratic wave year of 2018, it's not surprising the Democratic party registration exceeded 30 percent, while in 2020, registered Republicans have increased their share to 28 percent, with unaffiliated voters taking a two-percentage point drop.
In just looking at just 2020 by month, the impact of COVID-19 on the numbers of registered voters is remarkable, but interestingly, by October, the same number of new registered voters had joined the pool as in 2016.
Only in April, August, and the first nine days of October, registered Republicans exceeded registered Democrats, but as has been the case, registered Unaffiliated voters exceeded both. At the end, both parties secured a little over 101,000 new voters each, with unaffiliated voters at over 140,000.
Looking into 2020's new voters, their demographic details point to the transformation underlying the potential electorate, especially as it relates to generations, voter race-ethnicity, and where voters are located regionally.
Based on the racial-ethnic demographic data of NC's voters, the 2020 'new voters' are less white/non-Hispanic, but much more 'unknown,' as Chris pointed out in a blog piece earlier this year.
Several interesting dynamics are occurring among some key groups of voters. A plurality of new White non-Hispanic voters have registered unaffiliated, with registered Republicans second and registered Democrats below twenty percent. Among Black/African American non-Hispanic new voters, the rise of the Unaffiliated voter is playing out amongst this group as well.

We should add that just because Black voters are increasingly opting for Unaffiliated status doesn't mean that their vote preferences and choices are moving into independently as well: especially in the South, Black voters are loyal Democratic voters when it comes to casting ballots (at levels 90 percent or greater often in elections).
Another key group of voters to watch in North Carolina are Hispanic/Latino voters. Even though they only make up three percent of this year's total registered voters, their growing influence is felt in the fact that since 2016, Hispanic/Latino voters have been 6 percent of new voters. Among these new Hispanic/Latino voters, 86 percent of them registered either Unaffiliated or Democratic.
Turning to generational cohorts: as has been the case, voters under the age of 40 (Millennials and Generation Z) are driving the Unaffiliated registration increases. These two generations alone make up nearly two-thirds of the new voters since 2016, while among the overall 7.2 million registered NC voters, Millennials and Gen Z make up 36 percent of the voter pool.

Finally, each of the state's regions--urban central cities, suburbs within urban counties, surrounding suburban counties, and rural counties--have also seen witness the rise of the Unaffiliated, but in some areas, the purple hues are tinted either blue or red.

It's not surprising that within central cities, the registered Republican rate has dropped dramatically, down to 15 percent. Within the surrounding suburban counties, Democratic registration is down to 22 percent, while in the urban suburbs, the parties are splitting the registration, reflective of that region's battleground nature.
One more characteristic of these new registered voters is worth considering: of the one million new registrants who indicated their birth state, only 27 percent (382,000) are natives of the Old North State. In-migrants come from all over the country (and world), but, after North Carolina, the new North Carolina voters are most likely to hail from New York, Virginia, Florida, California, and Pennsylvania. Clearly in-migration from outside the South continues to be a key driver of the changes in North Carolina politics.
There will certainly be changes to the voter pool in North Carolina as some will take advantage of 'same day' registration and voting during absentee onestop voting (around 100,000 people availed themselves of this option in 2016). Nonetheless, the lion's share of the November potential electorate is set.
As we have seen, the electorate in North Carolina is growing. It's increasingly young, increasingly Unaffiliated, and increasingly from out of state. These changes aren't a challenge to the trends in North Carolina politics, but rather are just the acceleration of trends that have been occurring for over a decade. In a state like North Carolina where electoral wins are often decided on a razor's edge, even the acceleration of an existing trend could be enough to determine who ultimately prevail.
Dr. Michael Bitzer is the Leonard Chair of Political Science and professor of politics and history at Catawba College, and tweets at @BowTiePolitics.
Dr. Chris Cooper is the Madison Distinguished Professor of Political Science and Public Affairs at Western Carolina University, and serves as department head of political science and public affairs. He tweets at @chriscooperwcu.